We shipped GPU autoscaling for our ECS module. Version 8.3.0 added a target-tracking policy that
scales the service on GPU utilization, and a CloudWatch dashboard to watch it work. I opened the
dashboard on a live fleet, and every GPU panel said the same thing: No data available. The
scaling policy that reads the same metric sat in INSUFFICIENT_DATA. The alarm had never seen a
single datapoint.
The GPUs were fine. They were sitting in the fleet, advertised to ECS, serving the workload. The metric that was supposed to describe them had never been published – not once. The policy was tracking a series that did not exist, and a target-tracking policy with no data does nothing at all.
This is the story of why, and of the four reasonable fixes that each died on a real EC2 instance before the fifth one worked. It is a sequel to Serving a 7B Model on ECS GPU Instances You Own: that post put a model on the fleet; this one tried to make the fleet grow and shrink with load, and found out the hard way that a config which renders is not a metric that flows.
The ask: scale the GPU service on GPU load
The prequel ended with a working service – a tuned model behind vLLM on two GPU nodes, on an ECS cluster our Terraform module builds. Serving was solved. The next thing anyone wants from a serving fleet is for it to size itself: add capacity when the GPUs are busy, give it back when they’re idle, with no human watching a graph at 2 a.m.
On paper this is a solved problem – ECS has autoscaling, CloudWatch has metrics, put them together. In practice a GPU service on ECS has two things to scale, on two different layers, and the metric you most want to scale on is the one AWS does not give you for free. Getting the control loop right was real work even before anything broke. So Act I is the design. Act II is the bug.
Act I – the control loop
Two levers, two controllers
An ECS service on an EC2 capacity provider has two independent knobs:
- How many tasks run – the ECS service’s
desiredCount, driven by Application Auto Scaling. - How many instances exist – the Auto Scaling Group’s size, driven by the ECS capacity provider’s managed scaling.
These are separate controllers, and it matters which one you point at what. The GPU policy belongs on
the task layer: when GPU utilization climbs, Application Auto Scaling raises desiredCount, and
each new task needs a GPU. The instance layer follows automatically – the capacity provider watches
for tasks that can’t be placed (a new task needs a GPU, every current instance’s GPU is taken) and
grows the ASG to fit. It runs on a CapacityProviderReservation metric with target_capacity = 100:
keep just enough instances that all tasks are placed with no idle headroom.
So the loop is: GPU utilization drives task count; task count drives placement pressure; placement pressure drives instance count; more instances let more tasks run; more tasks bring utilization back down.
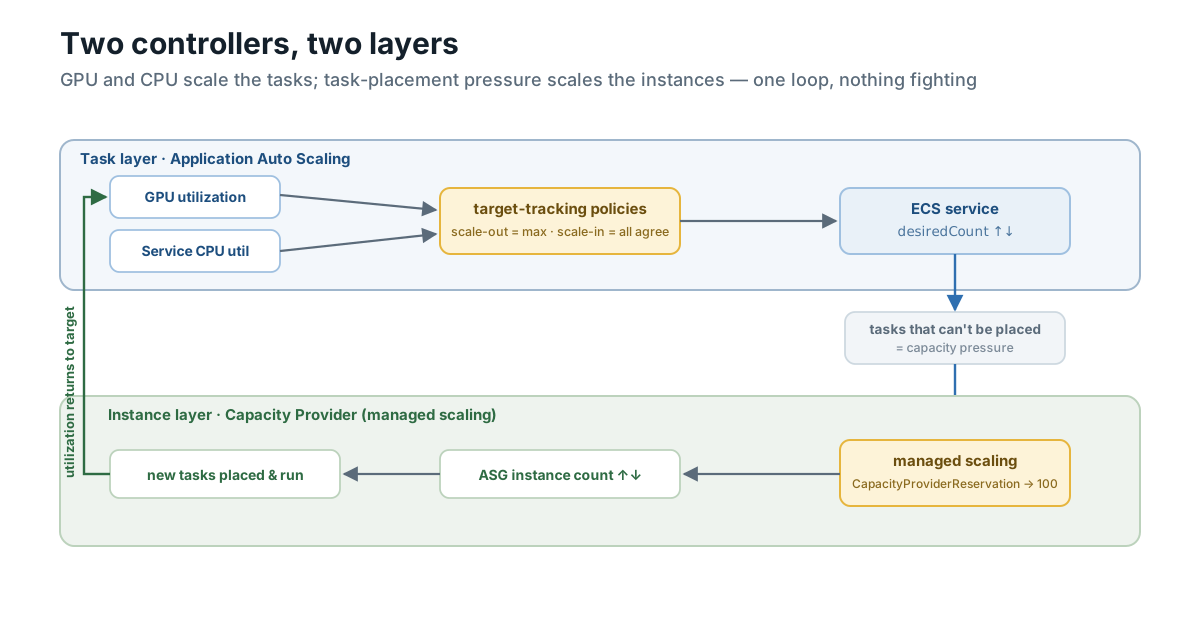
Two controllers, two layers. Task policies move desiredCount; the capacity provider sizes the ASG
from placement pressure. The operator tunes one number – the GPU utilization target – and everything
downstream is derived.
Scale on GPU and CPU, both on the task layer
A GPU inference service is not always bottlenecked on the GPU. Tokenization, request handling, JSON serialization, and the HTTP layer all run on the CPU, and under a burst of small requests the CPU can saturate while the GPU still has headroom. If you scale on GPU alone, the service falls over on CPU while the autoscaler insists everything is fine.
So the module keeps the existing CPU target-tracking policy alongside the new GPU one – two policies on one scaling target. Application Auto Scaling combines them the sensible way: scale-out on the maximum (either signal hot adds a task), scale-in only when both agree (the service shrinks only when GPU and CPU are slack). Both policies converge because adding a task genuinely relieves both dimensions – a new task takes its share of requests off the CPU and its share of inference off the GPU.
Do not scale instances on host CPU
Here is the trap that took the longest to see.
Our load-balancer submodule (website-pod) attaches an
ASGAverageCPUUtilization policy to the ASG by default – a perfectly good policy for a stateless web
fleet. On a GPU capacity provider it is actively harmful. It is a second controller fighting the
first: managed scaling is already sizing the ASG from task placement, and now a CPU policy is
sizing the same ASG from host CPU.
Worse, it can’t even do its job. Adding an instance does not relieve host CPU pressure – ECS does not migrate running tasks onto the new box, so the busy tasks stay exactly where they are while a fresh, idle, expensive GPU instance boots next to them. You pay for a GPU to lower a CPU number it cannot move.
The fix reached into website-pod. We made its autoscaling_target_cpu_load
nullable in release 6.3.0,
and the ECS module passes null for GPU services:
# website-pod.tf – drop the host-CPU ASG policy on GPU fleets so the
# capacity provider is the only thing sizing the instance count.
autoscaling_target_cpu_load = var.gpu_count > 0 ? null : var.autoscaling_target_cpu_usage
With that policy gone, managed scaling is the sole instance controller, and the two-controller model is clean: task policies on the task layer, capacity provider on the instance layer, nobody fighting.
(That nullable change had its own small adventure – a Terraform validation and a check block that
both eagerly interpolated the value into an error string and crashed on null with
Invalid template interpolation value. check-block error messages are evaluated eagerly, not
lazily, so a null-safe tostring(x == null ? "null" : x) was the fix. A different post.)
The ODCR floor
Autoscaling down to zero is the whole point of autoscaling, but a serving fleet usually wants a
warm floor – a couple of GPU instances always running so the first request of the day doesn’t wait
on a cold GPU boot. We keep that floor with a targeted On-Demand Capacity Reservation: reserve N GPU
instances, and hold asg_min_size at N so the fleet never drops below the reserved capacity it’s
already paying for.
One sharp edge worth flagging: there is no aws_ec2_capacity_reservation data source in the AWS
provider, so Terraform can’t read the reservation’s instance count back to set the floor
automatically. The module takes the reservation ID and leans on you to set asg_min_size to match –
a documented consumer relationship, so the module never becomes the reservation’s owner.
The dashboard
The last piece was observability: a CloudWatch dashboard with GPU utilization, service CPU, GPU memory, task count, and instance count on one screen. The point is to see the CPU-bound/GPU-idle signature when it happens and decide whether you have the wrong instance type. That dashboard is also what exposed the bug – I built it, deployed it, opened it, and every GPU panel was empty. Which brings us to Act II.
Act II – the metric that never published
The report came in as issue #173. A
user – @kendrickpham-tinyfish – hit it before I did: on
a GPU host the CloudWatch agent can’t find nvidia-smi, crash-loops, and the GPU metric never shows
up in CloudWatch. Everything 8.3.0 built on top of that metric – the policy, the alarms, the
dashboard – was sitting on a series that was never being written.
The honest root cause is a judgment error, and it’s worth naming plainly. The module’s GPU tests are not in CI – they need real GPU hardware and cost real money – so they run on demand. The one that was run before 8.3.0 shipped is a scaling test that publishes its own synthetic metric to drive the policy. It exercised the policy beautifully and never once touched the collection path. The test that would have caught this – the one that asserts the agent actually emits the metric end to end – was not run before the release. I assumed that because the agent config rendered correctly, the metric would be there. In infrastructure, an assumption is an untested hypothesis, and this one was wrong.
So I took a KEEP_AFTER instance, went in over SSM, and started killing theories.
Theory 1 – “the config is missing something”
First guess: the agent’s config is subtly wrong, so it never starts collecting. Wrong. The config
renders fine and the agent starts – then dies, because it can’t run nvidia-smi:
[root@ip-10-1-… ~]# docker ps -a --filter name=cloudwatch-agent \
                       --format '{{.Status}} :: {{.Names}}'
Exited (1) 29 seconds ago     :: ecs-…-cw-agent-daemon-9-cloudwatch-agent-d4a6909b8fdd
Exited (1) 40 seconds ago     :: ecs-…-cw-agent-daemon-9-cloudwatch-agent-8ec2b4b8cfa6
Exited (1) 51 seconds ago     :: ecs-…-cw-agent-daemon-9-cloudwatch-agent-90ff96dec88e
Exited (1) About a minute ago :: ecs-…-cw-agent-daemon-9-cloudwatch-agent-fcc89297d9e0
Exited (1) About a minute ago :: ecs-…-cw-agent-daemon-9-cloudwatch-agent-c6d0c989e5e9
Exited (1) 2 minutes ago      :: ecs-…-cw-agent-daemon-9-cloudwatch-agent-a8a1f9ac9282
…
A wall of restarts. The agent log says exactly what’s wrong:
E! Error running agent: validate input plugin nvidia_smi failed because of
   Cannot get file's stat /usr/bin/nvidia-smi: no such file or directory
The config is right. The nvidia_gpu collector shells out to nvidia-smi, and inside
the CloudWatch agent container nvidia-smi does not exist. The problem is not the config; the
container cannot see the GPU at all.
Theory 2 – “just add the NVIDIA env vars”
This is what PR #174 proposed,
and it’s the reflexive answer anyone who has run GPU containers gives:
set NVIDIA_VISIBLE_DEVICES=all and NVIDIA_DRIVER_CAPABILITIES=utility on the container, and the
NVIDIA runtime injects the driver. It’s the documented mechanism. It did nothing. The reason is one
line of docker info:
[root@ip-10-1-… ~]# docker info | grep -iE 'Default Runtime|Runtimes'
 Runtimes: io.containerd.runc.v2 nvidia runc
 Default Runtime: runc
The nvidia runtime is registered, but the default runtime is runc. The env-var injection is a
feature of the nvidia runtime. A container running under runc can have NVIDIA_VISIBLE_DEVICES
set to anything it likes; nothing reads it. The variables are inert.
Theory 3 – “make nvidia the default runtime”
If the env vars only work under the nvidia runtime, make that the default. Set
default-runtime = nvidia in daemon.json and restart. This produced two separate lessons, both
painful.
The first was a systemd trap. I dropped the config and ran systemctl restart docker in the
instance’s runcmd. That wedged ECS:
[root@ip-10-1-… ~]# systemctl is-active ecs
inactive

[root@ip-10-1-… ~]# systemctl cat ecs | grep -E 'Wants|PartOf|After'
Wants=docker.service
PartOf=docker.service
After=docker.service
ecs.service is PartOf=docker.service. Restarting docker propagates to everything that is PartOf
it, so my “quick restart” took the ECS agent down with it, and docker ps came back empty. The fix
was to stop restarting docker at all: lay daemon.json down with cloud-init write_files, which runs
before docker starts, so docker comes up on the nvidia runtime the first time and never needs a
bounce.
That worked – the container came up on the nvidia runtime – and it still didn’t get a GPU. This was
the deeper wall. The AL2023 toolkit (1.19) runs with mode = "auto", which resolves to CDI on this
AMI, and in that mode it does not do the old env-var injection for a container that hasn’t been
assigned a device. I tried every incantation.
NVIDIA_VISIBLE_DEVICES=all, the CDI device name, even flipping
accept-nvidia-visible-devices-envvar-when-unprivileged = true in the toolkit config:
== accept-nvidia-visible-devices-envvar-when-unprivileged = true, retest ==
  VIS=all                 -> exec /usr/bin/nvidia-smi: no such file or directory
  VIS=nvidia.com/gpu=all  -> exec /usr/bin/nvidia-smi: no such file or directory
Still nothing. On this AMI, being on the nvidia runtime is not enough.
Theory 4 – “use CDI directly”
If the AMI wants CDI, speak CDI. The toolkit does enumerate the GPU as CDI devices:
[root@ip-10-1-… ~]# nvidia-ctk cdi list
nvidia.com/gpu=0
nvidia.com/gpu=GPU-0a5958de-23ea-f1ff-1626-73a7aaf0c09c
nvidia.com/gpu=all
Out of the box docker refuses them – docker run --device nvidia.com/gpu=all returns
could not select device driver "cdi" until you actually enable CDI with features.cdi = true in
daemon.json. So I enabled it, restarted docker, and tried again. Now docker accepts the device
and still injects nothing:
[root@ip-10-1-… ~]# # features.cdi = true set, docker restarted
[root@ip-10-1-… ~]# docker run --rm --device nvidia.com/gpu=all --entrypoint nvidia-smi <image> -L
exec /usr/bin/nvidia-smi: no such file or directory
That experiment was academic anyway, and this is the part that actually closes the door: an ECS
task definition has no way to request a CDI device. The only device knob is
linuxParameters.devices – host-path to container-path mappings – and the only GPU knob is
resourceRequirements, which reserves a whole GPU. There is no field that says “attach CDI device
nvidia.com/gpu=all.” Even if docker CDI had injected cleanly, ECS could never ask for it. Four
theories, four instances, four dead ends – each one reasonable, each one documented somewhere, each
one killed by a command on a real box.
The realization – how the app container gets its GPU
The whole time, one container on the same host could see the GPU perfectly: the workload itself.
So I stopped asking “why can’t the agent see the GPU” and asked “how does the app container see it.”
The answer is in /proc/mounts inside the working container:
[root@ip-10-1-… ~]# docker exec <app-container> cat /proc/mounts | grep nvidia
/dev/nvme0n1p1 /usr/bin/nvidia-smi              xfs ro,…  0 0
/dev/nvme0n1p1 /usr/bin/nvidia-persistenced     xfs ro,…  0 0
/dev/nvme0n1p1 /usr/lib64/libnvidia-cfg.so.580.159.03  xfs ro,…  0 0
/dev/nvme0n1p1 /usr/lib64/libnvidia-allocator.so.580.159.03 xfs ro,…  0 0
…
nvidia-smi and the driver libraries are bind-mounted in from the host – from /dev/nvme0n1p1,
the host’s root disk. Nothing is installed in the image. nvidia-container-cli reached in and mounted
the host’s driver stack into the container’s filesystem. And it did that for one specific reason –
the container has a device assignment ECS made:
[root@ip-10-1-… ~]# docker inspect <app-container> --format '{{range .Config.Env}}{{println .}}{{end}}' | grep NVIDIA
NVIDIA_VISIBLE_DEVICES=GPU-0a5958de-23ea-f1ff-1626-73a7aaf0c09c
That is the whole mechanism. The app container’s task definition has resourceRequirements asking
for a GPU. The ECS agent (ECS_ENABLE_GPU_SUPPORT=true) picks a specific physical GPU, sets
NVIDIA_VISIBLE_DEVICES to that GPU’s UUID – not all, the exact UUID – and that assignment is
what triggers nvidia-container-cli to bind-mount the driver in. On the AL2023 GPU AMI, GPU
injection is gated behind ECS’s own device assignment. No reservation, no GPU. The sidecar agent
never reserved one, so it never got one – and it never could, because reserving a GPU for a telemetry
sidecar would steal it from the workload on a single-GPU box.
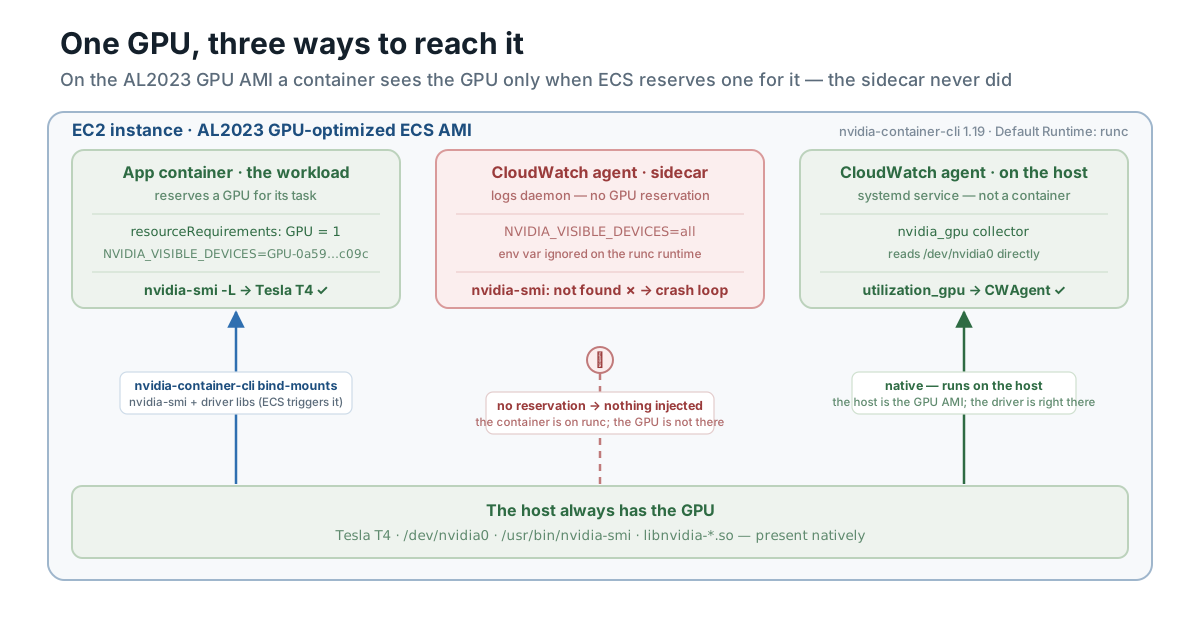
One GPU, three ways to reach it. The app container gets the driver bind-mounted because ECS assigned it a GPU; the sidecar agent, with no reservation, gets nothing; the host has the GPU natively.
A sidebar for anyone porting old GPU-on-ECS guides: this behavior is specific to AL2023. The legacy
Amazon Linux 2 GPU AMI shipped default-runtime = nvidia and honored env-var injection – which is why
the wrapper-image, set-the-env-vars approach worked for years and shows up in every tutorial. AL2023
moved to a runc default with CDI, and that quietly closed the door. The AL2 GPU AMI reached
end-of-life on 2026-06-30, so building on the old
behavior is building on sand.
The fix – collect on the host
Once the mechanism is clear, the fix writes itself. The host does not need anything injected – the
host is the GPU AMI. nvidia-smi is right there, natively:
[root@ip-10-1-… ~]# nvidia-smi -L
GPU 0: Tesla T4 (UUID: GPU-0a5958de-23ea-f1ff-1626-73a7aaf0c09c)
So we stopped trying to give a container a GPU and moved GPU collection to where the GPU already is.
The module now runs a host-level CloudWatch agent – a plain systemd service, installed with
dnf install amazon-cloudwatch-agent and configured with amazon-cloudwatch-agent-ctl -a fetch-config
– whose only job is the nvidia_gpu collector. Its config is tiny and pointed at exactly the series
the scaling policy tracks:
{
  "agent": { "run_as_user": "root" },
  "metrics": {
    "namespace": "CWAgent",
    "append_dimensions": { "AutoScalingGroupName": "${aws:AutoScalingGroupName}" },
    "aggregation_dimensions": [["AutoScalingGroupName"]],
    "metrics_collected": {
      "nvidia_gpu": {
        "measurement": ["utilization_gpu", "memory_used", "memory_total"],
        "metrics_collection_interval": 60
      }
    }
  }
}
Aggregating on AutoScalingGroupName is what makes it a fleet metric the policy can target, rather
than a pile of per-instance series. The containerized CloudWatch agent stays exactly as it was –
logs only, no GPU, no crash loop.
There was one more gate: IAM. The host agent came up, ran the collector, and immediately got told no:
E! cloudwatch: code: AccessDenied, message: User:
   arn:aws:sts::<account>:assumed-role/test-…-instance-…/i-0ad34247… is not authorized to
   perform: cloudwatch:PutMetricData because no identity-based policy allows the
   cloudwatch:PutMetricData action
The collector was reading the GPU perfectly and had nowhere to write it. The fix is a namespace-scoped
cloudwatch:PutMetricData statement on the instance role, added only when gpu_count > 0. With that
in place, the metric finally lands:
[laptop]$ aws cloudwatch get-metric-statistics --namespace CWAgent \
    --metric-name nvidia_smi_memory_total \
    --dimensions Name=AutoScalingGroupName,Value=test-tbf… \
    --period 60 --statistics Average --start-time … --end-time …
2026-07-18T21:42:00Z   15360.0
2026-07-18T21:43:00Z   15360.0
2026-07-18T21:44:00Z   15360.0
memory_total = 15360 – a real Tesla T4 reporting its 15,360 MiB, once a minute, aggregated by ASG.
The producer moved from a doomed sidecar to the host, and the scaling policy can’t tell the
difference: it’s the same metric name in the same namespace with the same dimension.
A second bug, hiding behind the first
Collecting on the host introduced a regression I only caught while gathering screenshots for this
post. The host agent’s fetch-config owns /opt/aws/amazon-cloudwatch-agent/etc/, and the
containerized logs agent had been mounting its own config from a file in that same directory. The host
agent’s fetch clobbered it, turned the file into an empty directory, and the logs agent went into its
own crash loop – while the GPU metric kept flowing, so the GPU test stayed green. Two agents, one
config directory, silent collision. The fix was to give the container agent its own path,
/etc/ecs-cloudwatch-agent-config.json, well away from the host agent’s turf, and to add a test
assertion that the logs agent is actually Up and not looping. It is the same lesson as the whole
post, one level down: a green test that never checked the thing that broke.
Proof – the loop actually scales
A fix you can’t demonstrate is a hope. Two tests carry this one, and both run on real GPU hardware.
The emission test is the one that would have caught the original bug. It stands up a GPU service, waits for the ASG instance refresh to finish, and asserts the metric is actually in CloudWatch:
Containerized logs cloudwatch-agent is running: Up 18 minutes
GPU metric nvidia_smi_memory_total       present (14 datapoints, latest Average=15360.0)
GPU metric nvidia_smi_memory_used        present (14 datapoints, latest Average=0.0)
GPU metric nvidia_smi_utilization_gpu    present (14 datapoints, latest Average=0.0)
PASSED
It checks both things now – the logs agent is up, and every GPU series has real datapoints. The
scaling target reads nvidia_smi_utilization_gpu, and there it is.
The scaling test drives the policy deterministically. Rather than trying to peg a real GPU to 100%, it publishes a high synthetic utilization value and watches the controller respond – then stops, and watches it come back:
desiredCount: 1  →  (GPU utilization forced high)
desiredCount: 2  ✓  scale-out
… load removed …
desiredCount: 1  ✓  scale-in
Application Auto Scaling creates the High/Low alarm pair for each policy automatically, so a GPU service ends up with four alarms – CPU-High, CPU-Low, GPU-High, GPU-Low – the two controllers, wired. One honest note on latency: scale-out took roughly 3 to 11 minutes across runs. Target-tracking waits out its alarm’s evaluation periods, then the task starts, and on a scale-out that needs a new instance the capacity provider has to boot a GPU box first. This is background autoscaling for a serving fleet, not request-path load balancing, and that’s the right expectation to set.
What to take from this
Everything you assume might fail. The root error here was not a wrong line of code – every fix in this post was a reasonable idea sourced from AWS docs, the NVIDIA toolkit docs, or a contributor’s working wrapper. The error was assuming the metric would be there because the config was valid. In infrastructure, an assumption is a hypothesis you haven’t run yet. Treat it that way.
A rendered config is not a flowing metric. The agent config was correct the entire time. Correct config, valid syntax, agent starts – and zero datapoints, because the runtime never handed the agent a GPU. Assert the metric lands, end to end, on real hardware.
Mocked tests are a special danger in infrastructure. The scaling test published its own metric, so it drove the policy and never touched collection. It was green the whole time the real pipeline was dead. The only test that would have caught the bug is the one that exercises the actual agent-to-CloudWatch path – and it wasn’t run before the release. Documentation is a starting point; only the experiment on real hardware is proof.
Platform gates are invisible until you hit them. AL2023’s move to CDI and a runc default closed
the env-var injection door that AL2 left open, and nothing announced it. The old tutorials still read
as correct. They’re describing a platform that’s aging out.
Two controllers, two layers. The reusable design, if you take nothing else: scale tasks on task signals (GPU and CPU together), let the capacity provider scale instances from placement pressure, and keep any host-CPU ASG policy away from a GPU fleet. That model is the part of this that outlives the bug.
The fix shipped in #175, building on @kendrickpham-tinyfish’s report and PR – with thanks. If you run GPU workloads on ECS and want the two-controller autoscaling without rediscovering any of this on a live instance at midnight, that’s exactly what the module is for.