If It Ain't Stress Tested, It's Broken
- Oleksandr Kuzminskyi
- January 4, 2026
Table of Contents
On Friday, December 26th, 2025, I released a bugfix for our private PyPI server. The server had been running
for months in a degraded single-instance mode to work around a cache synchronization bug across EFS-backed
containers. With caching enabled, the single instance performed well, but adding more instances would trigger
the bug. The fix removed caching entirely by switching to --backend simple-dir, which meant we could finally
restore high availability.
Saturday morning, the availability alert fired. The server was down.
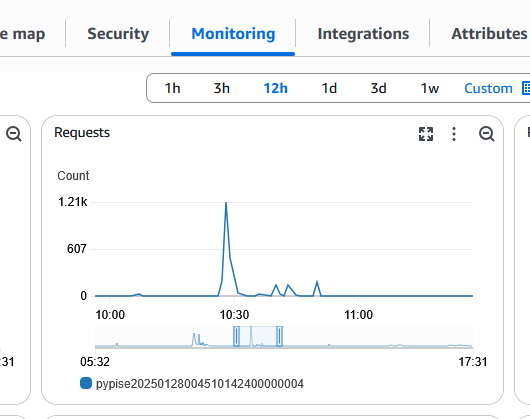
Looking at CloudWatch, I found the culprit: a spike of 1.21k requests around 10:30 AM. I had assumed this internal service received trivial traffic. Turns out, there were occasional bursts of 1000+ requests per minute that I never knew about. The single instance with caching had been fast enough to handle these spikes. But now, without caching and with traffic distributed across multiple containers, the system couldn’t keep up.
The service wasn’t broken by the fix. The fix just exposed that it had been broken all along.
The Service That “Worked”
The pypiserver is a private Python Package Index (PyPI) that we run for
a customer. It hosts their internal Python packages and dependencies, allowing their development teams
to use pip install and poetry install just like they would with the public PyPI, but pulling packages
from their private repository.
We deploy it on AWS using ECS containers with an Application Load Balancer for traffic distribution and EFS (Elastic File System) for shared storage of the Python packages. The architecture is straightforward: multiple containers can serve requests simultaneously, all reading from the same EFS mount containing the package files.

The original deployment used pypiserver’s default caching backend, which maintains an in-memory cache of package metadata to speed up lookups. This worked perfectly fine with a single container. But when we tried to run multiple containers for high availability, we discovered a bug: the cache wasn’t synchronized across containers. When a new package was uploaded, one container would update its cache while the others remained stale. Clients would get inconsistent results depending on which container handled their request.
The workaround was simple: run only one container. No multiple instances meant no cache synchronization issues. The service was available, but we’d lost high availability. If that single container died, the service went down until ECS could launch a replacement.
The fix came months later when I discovered the --backend simple-dir option, which disables caching entirely
and reads package metadata directly from the filesystem on every request. No cache meant no synchronization
problem. We could finally run multiple containers again.
I knew disabling the cache would hurt performance, but I was okay with the tradeoff. The traffic seemed trivial, and we already had autoscaling configured. I assumed that if load increased, ECS would just spin up more containers to handle it. What I didn’t account for was the actual traffic pattern.
The Incident
Looking at the CloudWatch graph, I saw the request count spike to 1.21k requests around 10:30 AM, while the response count dropped to zero. The service was completely unavailable.
ECS noticed the failed health checks and started replacing the dead containers. New tasks launched, passed their health checks, and started serving traffic again. For a while, things looked okay. The service was back up.
But I knew this was just temporary. The spike pattern would return. When it did, the same containers would fail again. ECS would replace them again. The cycle would repeat. We had a service that worked fine under normal load but collapsed every time CI/CD pipelines kicked off their dependency resolution in parallel.
The real problem wasn’t the outage. It was that I had no idea what capacity the service actually needed to handle this traffic pattern reliably.
Stress Testing as Research
A common pattern I’ve seen is treating load testing as a pass/fail gate. You define an expected load, run a test, and if the service handles it without errors, you ship. If it fails, you add resources until it passes.
That framing assumes an untested service is probably fine until proven otherwise. In practice, the opposite is true. A service you haven’t stress tested isn’t fine - it’s simply unexamined. It contains dormant problems you haven’t uncovered yet.
A production incident made this painfully clear. The service appeared healthy as long as caching was enabled. The moment we changed the configuration and disabled caching, a performance issue that had always existed suddenly became critical. Nothing new had been introduced; the system was simply placed under conditions that allowed an existing weakness to surface.
At that point, it was clear my assumptions were wrong. The traffic wasn’t trivial, and the default autoscaling policy wasn’t adequate. Before shipping any fix, the pypiserver needed proper stress testing.
The goals of that testing were straightforward:
- Achieve acceptable error rates and response times on production-like traffic, with headroom for future growth
- Verify that the autoscaling policy actually works and reacts when needed
- Size the system correctly: instance type, container memory and CPU reservations, and task count
Over the next three days, I ran more than 75 tests and Terraform applies. Each run was an experiment designed to validate or disprove a specific theory about where the system was constrained. Stress testing became a process of observation: watching how the system behaved under load and using those observations to decide what needed to change.
You research the system. You probe it. You learn how it actually works - not how you assume it works.
Building the Stress Test
I’ve used JMeter since 2010. It’s a solid tool for load testing, but I don’t know it well enough to quickly replicate pip’s specific request behavior. Real pip clients do a redirect dance when fetching packages:
GET /{package}/→ 303 redirectGET /simple/{package}/→ 200 with package listGET /packages/{wheel}→ download the wheel file
Under time pressure on a Saturday, building a custom test in Python was faster than learning JMeter’s advanced redirect handling. Sometimes the tool you know beats the “right” tool.
I built the stress test using Python’s ThreadPoolExecutor. The test needed to replicate the production traffic pattern I saw in CloudWatch:
- 3 baseline workers maintaining low continuous load
- Bursting to 510 concurrent workers every 60 seconds
- Simulating the pip redirect flow for each package fetch
This profile matched the spike pattern that killed the service: 1000+ requests hitting the server when CI/CD pipelines started their dependency resolution in parallel.
The Investigation
The CloudWatch graph told me what happened. Now I needed to understand why.
The spike showed 1.21k requests - much higher than I expected. But knowing the traffic volume didn’t explain why the system couldn’t handle it. I needed to find the bottleneck.
Was It EFS?
My initial suspicion was that EFS was slow under load. The architecture uses EFS for shared package storage across containers, and EFS can throttle when you exceed throughput limits.
I checked the CloudWatch metrics for the EFS filesystem during the spike:
PercentIOLimit: 0.8% (nowhere near throttling)BurstCreditBalance: 2.3 trillion bytes (plenty of credits)
EFS wasn’t even stressed. The bottleneck was somewhere else.
The Real Problem: Memory Starvation
Running mpstat on one of the container instances showed the smoking gun:
18:02:10  CPU   %usr  %nice   %sys %iowait   %irq  %soft %steal %guest %gnice  %idle
18:02:10  all   4.19   0.00   6.54   84.40   0.00   0.50   1.01   0.00   0.00   3.36
84% iowait. The system was spending almost all its time waiting on I/O.
free -m revealed why:
              total   used   free  shared  buff/cache  available
Mem:            916    731     59       0         125         55
Swap:          2047    748   1299
The instance had 916MB total memory, only 55MB available, and 748MB actively swapped out. Under load,
vmstat showed the system thrashing:
procs -----------memory---------- ---swap-- -----io---- -system-- ------cpu-----
 r  b   swpd   free   buff  cache   si   so    bi    bo   in   cs us sy id wa st
 6  0 751768  63120    16 153284 2326 1795  7523  2000 1700 2797  8  4 57 29  1
 2  1 752076  63740    16 145172 6612 2216 14236  2220 3130 4611 87  5  5  3  0
The si (swap-in) and so (swap-out) columns showed constant swapping. The system was grinding on swap,
not EFS.
The Metadata Storm
Looking at NFS stats from mountstats explained why the memory pressure was so severe:
GETATTR: 41,630
LOOKUP:  71,197
READDIR:  3,840
READ:     2,408
The system performed 71,197 directory lookups, 41,630 file attribute checks, and 3,840 directory reads,
but only 2,408 actual file reads. pip and poetry’s simple index browsing hammers filesystem metadata.
Each stat(), lookup(), and readdir() call is an NFS round trip to EFS.
With minimal memory, the kernel couldn’t cache any of this metadata. Every request paid the full NFS latency penalty. Combined with active swapping, the effective latency became catastrophic.
Experiments and Dead Ends
With the root cause identified - memory starvation and swap thrashing - I started testing solutions.
More Gunicorn Workers
By default, pypiserver runs with a single Gunicorn worker. More workers means handling more concurrent requests. I modified the configuration to make the worker count configurable and ran tests with 2, 4, and 6 workers.
Multiple workers helped. The error rate dropped from 19.3% to 3-4%. Better, but not good enough for production. I also noticed that traffic wasn’t reaching all workers evenly - the ALB was sending most requests to only a few ECS tasks during the bursts.
Least Outstanding Requests Routing
The uneven load distribution seemed like the next problem to solve. By default, ALBs use round-robin routing - it cycles through targets, giving each one an equal share regardless of how busy they are. Round-robin assumes all requests are equal and quick. My requests weren’t: some were fast metadata lookups, others triggered the full 303 redirect chain with file I/O. When one instance got slow requests and started swapping, round-robin kept sending it 1/3 of all new requests anyway.
I switched to the least_outstanding_requests algorithm, which routes traffic to the target with
the fewest active connections. This algorithm shines when requests vary in complexity - it notices
that Target A is still processing 50 slow requests while Target B has finished its work, and sends
new traffic to B. I’d read a blog post from Travis J. Gosselin
where this change improved throughput by 50% for a workload with variable request duration.
The change made no difference for my workload.
The problem: LOR needs time to observe the system state. The ALB tracks outstanding requests per target and updates that count when requests complete. With 510 requests arriving in milliseconds, the ALB makes routing decisions faster than it receives feedback about which targets are struggling.
At t=0, all targets show zero outstanding requests - they’re all equally “least outstanding.” By the time the ALB observes “Target A has 170 pending requests,” it has already routed 170 more to it. The feedback loop is too slow for instantaneous bursts.
LOR works well for steady traffic with variable request duration. It doesn’t help when all the requests arrive at once - there’s no “least outstanding” to route to because nobody has started processing yet.
The Insight: Vertical Before Horizontal
After exhausting the “distribute load better” approaches, I stepped back and reconsidered the problem. The ALB couldn’t distribute 510 simultaneous requests evenly. The problem wasn’t total capacity - ALBs handle far more than 510 requests - but the lack of feedback during instantaneous bursts. By the time the ALB had routing feedback, the damage was done. More workers per container helped, but didn’t solve the uneven distribution: some targets were overloaded while others sat idle.
The conventional wisdom for scaling is “add more instances.” But if load distribution is inherently uneven during bursts, adding more small instances just creates more targets that can individually fail. The insight was counterintuitive: instead of spreading the load across many small instances, make each instance capable of absorbing an unfair share of the spike.
The production incident happened on t3.micro instances (1 vCPU, 1GB RAM), where the 916MB of memory caused the swap thrashing I described earlier. Before starting the stress tests, I’d already upgraded to t3.small (2GB RAM) and verified the containers weren’t swapping. The memory problem was solved, but the service still couldn’t handle the bursts.
With swapping eliminated, the bottleneck shifted to CPU. The t3.small has 2 vCPUs, and during bursts, the overloaded targets were CPU-bound while others remained idle. The problem wasn’t total capacity - it was that the ALB couldn’t distribute load evenly enough to use that capacity.
I looked for the next instance type that would give me significantly more headroom. The c6a.xlarge offered 4 vCPUs and 8GB of RAM - eight times the memory. The “c” family is compute-optimized, which seemed appropriate for a service doing mostly CPU work (Python request handling) rather than memory-intensive operations.
The results were dramatic:
| Metric | t3.small baseline | c6a.xlarge |
|---|---|---|
| Error Rate | 19.3% | 0.05% |
| 5xx Errors | 101 | 3 |
| P95 Latency | 27,055 ms | 13,929 ms |
With 4 vCPUs instead of 2, each instance could handle a larger share of the burst without becoming CPU-bound. The extra memory also helped - with 8GB of RAM, the kernel had plenty of room to cache EFS metadata, so the 71,000 LOOKUP operations hit the page cache instead of making NFS round trips.
The final configuration runs 2 c6a.xlarge instances with 12 ECS tasks total, each task running 4 Gunicorn workers. The service now handles the 510-request bursts with a 99.95% success rate.
The lesson: when you can’t control how load is distributed, make each node strong enough to handle the worst-case distribution. Vertical scaling isn’t always the wrong answer.
The Results
Between December 27th and December 30th, I ran about 75 stress tests. Each test was a hypothesis: “If I change X, how will the system behave, will error rate improve?” The worker count experiments showed that parallelism helped but wasn’t sufficient. The ALB routing algorithm tests revealed the feedback loop timing problem. The timeout tunings confirmed that the issue wasn’t client-side. Each run added a piece to the puzzle, ruling out theories and pointing toward the real constraint: individual instance capacity under uneven load.
Here’s the before and after, both under the same 510-concurrent-request burst:
| Metric | Baseline (Dec 27) | Final (Dec 30) |
|---|---|---|
| Error Rate | 19.3% | 0.05% |
| Success Rate | 80.7% | 99.95% |
| P95 Latency | 27,055 ms | 13,929 ms |
| 5xx Errors | 101 | 3 |
The final configuration: 2 c6a.xlarge instances running 12 ECS tasks total, with 4 Gunicorn workers per task - 48 workers maximum across the cluster.
You might look at that P95 latency - nearly 14 seconds - and think something is still wrong. You’d be right. I’m not happy about it either.
At some point during the investigation, I had to choose between optimizing for error rate or response time. Achieving both would have required significant architectural changes - adding a caching layer in front of pypiserver, or replacing the Python-based server entirely with something faster. Those are valid options, but they weren’t changes I wanted to make at 2 AM on a holiday weekend.
So I made a trade-off: prioritize the error rate. A CI/CD pipeline that waits 14 seconds still completes successfully. A pipeline that gets a 502 error has to retry or fail the build entirely. For this use case, slow-but-successful beats fast-but-failing.
This isn’t the final state. I’ll observe how the system behaves under real traffic patterns and plan the next iteration. Maybe that means adding a smarter caching layer. Maybe it means replacing pypiserver with something more performant. The stress testing infrastructure is in place now, so whatever changes come next can be validated before they hit production.
The 3 remaining failures in the final test were transient - likely connections that timed out during the initial burst before the system stabilized. A 99.95% success rate under a 170x traffic spike is a reasonable place to stop for now.
Building the Tooling
The first few test runs were painful. I’d start a stress test, SSH into one of the EC2 instances,
run vmstat 3 and free -m, watch the numbers scroll by, then copy-paste the output into a file
for analysis. By the time I’d captured the diagnostics, the burst was over. I was always looking
at stale data.
I was using Claude Code to help with the investigation, and after a few rounds of me pasting
vmstat output, it started asking “what’s the memory situation now?” and “can you check iowait
during the next burst?” At some point I realized: instead of me collecting this data manually,
I should teach the test to collect it automatically.
Our infrahouse-core library already had an
ASGInstance class that could execute commands on EC2 instances via AWS Systems Manager. I
wrapped this into a DiagnosticsCollector that would:
- Find all running instances in the Auto Scaling Group
- Run
vmstat,free,mpstat, anddocker statson each one - Timestamp and save the output to a results directory
- Execute automatically during each burst iteration of the stress test
Now every test run produced a complete diagnostic snapshot. I could compare memory usage across
75 runs without manually SSH-ing into anything. When I suspected swap was the problem, I had
the historical vmstat data to prove it.
The meta-lesson: the same research mindset that applies to stress testing applies to the testing process itself. If you’re doing something manually more than twice, automate it. The tooling you build during an investigation often outlasts the specific problem you’re solving.
Lessons Learned
If it ain’t tested, it’s broken. The pypiserver ran for months without issues - or so I thought. The caching workaround masked a performance problem that was always there. Your service has failure modes you haven’t discovered yet. The question isn’t whether they exist, but whether you’ll find them in testing or in production.
Stress testing is research, not verification. The goal isn’t to run a test and check a box. It’s to understand how your system actually behaves under load. Each of my 75 test runs taught me something, even when the error rate didn’t improve. The failures were data.
Use what you know under pressure. I’ve used JMeter for 15 years, but under time pressure on a Saturday, building a custom test in Python was faster than figuring out JMeter’s advanced redirect handling. The “right” tool is the one that gets you answers quickly.
Follow the bottleneck. My initial assumption was that EFS was slow. The data said otherwise - EFS wasn’t even stressed. The real culprit was swap thrashing on undersized instances. Measure first, then theorize.
Challenge conventional wisdom. The least_outstanding_requests routing algorithm is supposed
to help with uneven load distribution. For bursty traffic, it made no difference. Best practices
are starting points, not guarantees.
Sometimes vertical beats horizontal. The answer wasn’t more small instances - it was fewer, larger ones. When you can’t control load distribution, make each node strong enough to handle the worst case.
Automate your investigation. The DiagnosticsCollector I built during this incident is now part of the module’s test infrastructure. The tooling you create while debugging often has lasting value.
Try It Yourself
The terraform-aws-pypiserver module is open source. It includes the stress testing infrastructure I built during this investigation - the custom pip simulator, the burst traffic profiles, and the DiagnosticsCollector. If you’re running a private PyPI server, you can use it to find out what your service can actually handle.
More importantly: stress test your own services. Pick something that’s been running “fine” for months and hit it with realistic traffic patterns. You might be surprised what you find.
If it ain’t stress tested, it’s broken. You just don’t know it yet.